Reporting & Data
Jestr gives you detailed reporting throughout your campaign, from overall performance down to individual creators and videos.
Your reporting updates as the campaign runs, allowing you to monitor performance, understand where your views are coming from, and see how your campaign budget is being used.
Campaign overview
At the top level, you can quickly see the overall performance of your campaign, including:
- Total views
- Budget used and remaining
- Campaign CPM
- Effective CPM
- Engagement rate
These metrics give you a quick snapshot of both the reach and efficiency of your campaign as it progresses.
For more information on the difference between CPM and effective CPM, see Budget, CPM & Rewards.
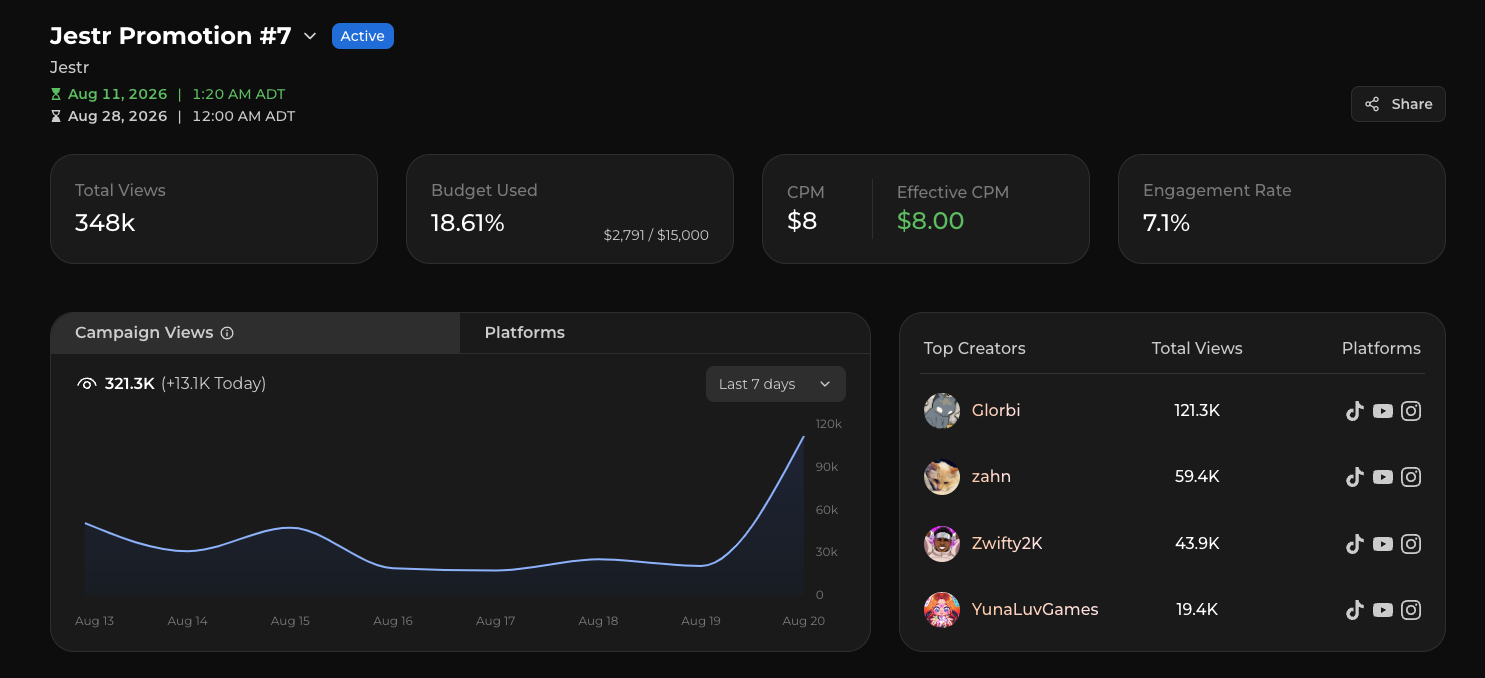
Campaign performance over time
Your reporting dashboard includes a views over time chart showing how your campaign has grown throughout its duration.
This makes it easier to see when content begins gaining traction, identify periods of increased activity, and understand the overall shape of your campaign's performance.
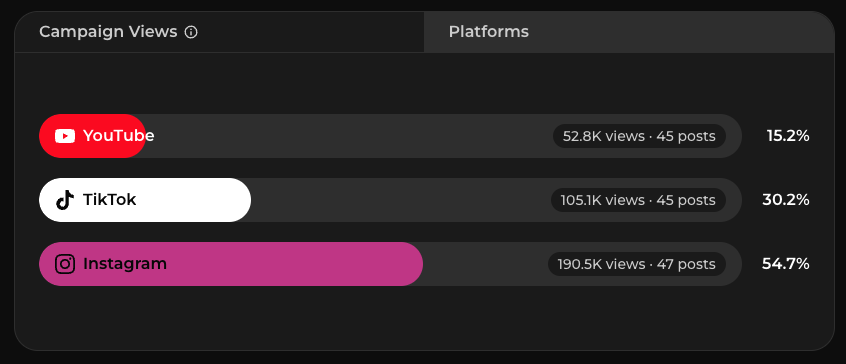
You can also see a platform breakdown of your campaign views, showing how much of your overall reach came from each supported platform.
When creators are posting
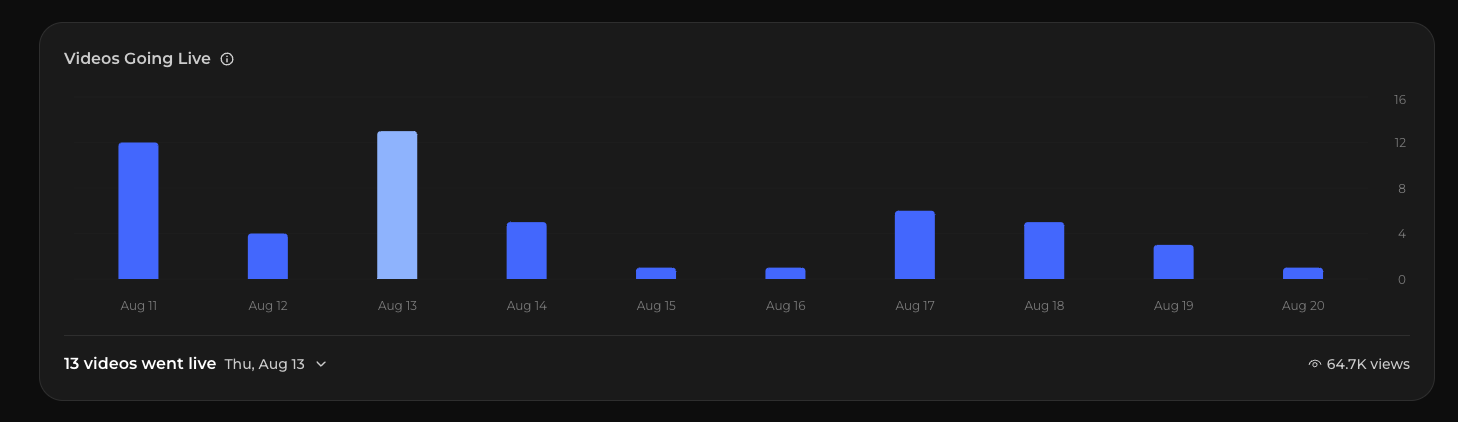
Jestr also shows when videos were published throughout your campaign.
The publishing activity chart gives you a visual breakdown of when creator content went live, making it easier to compare posting activity with changes in campaign views and performance.
Top creators
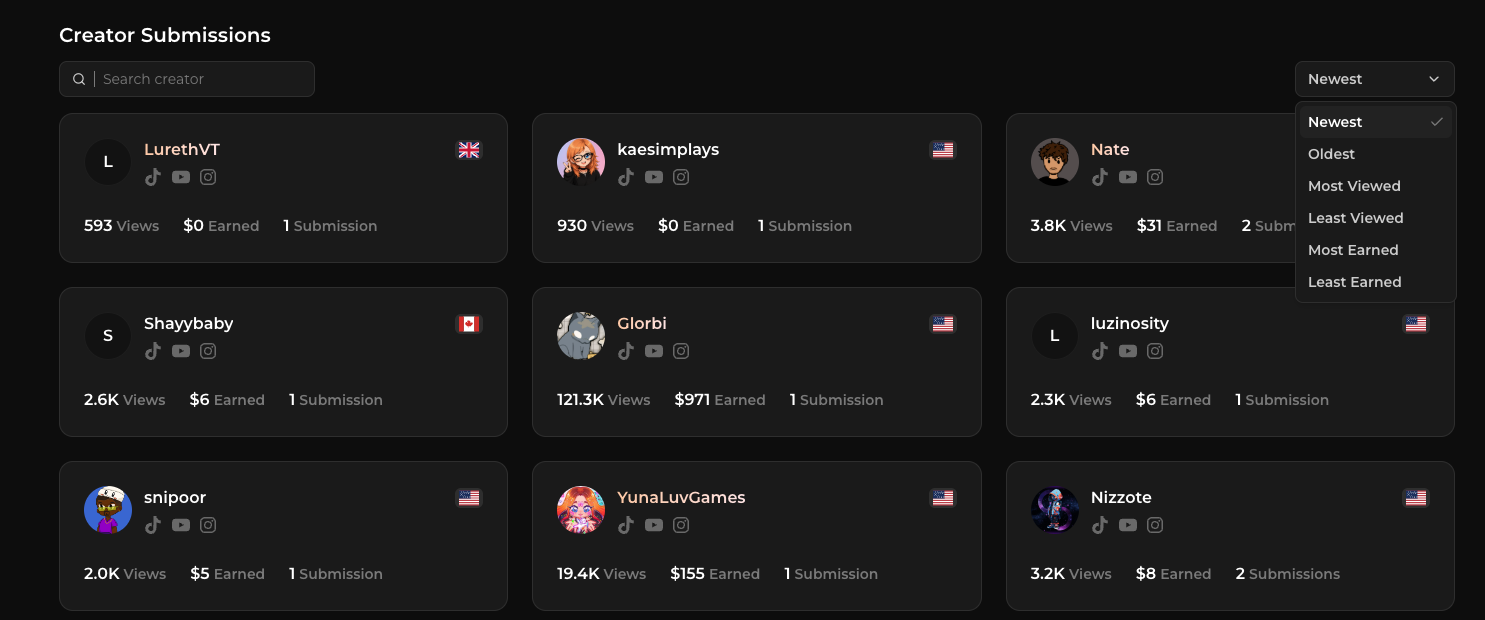
See which creators are contributing the most to your campaign and how each is performing.
For each creator, you can view information including:
- Total views
- Number of submissions
- Platforms posted on
- Creator country
- Campaign earnings
This makes it easy to identify standout creators, understand where your campaign is gaining traction, and find creators you may want to continue working with.
Browse campaign content
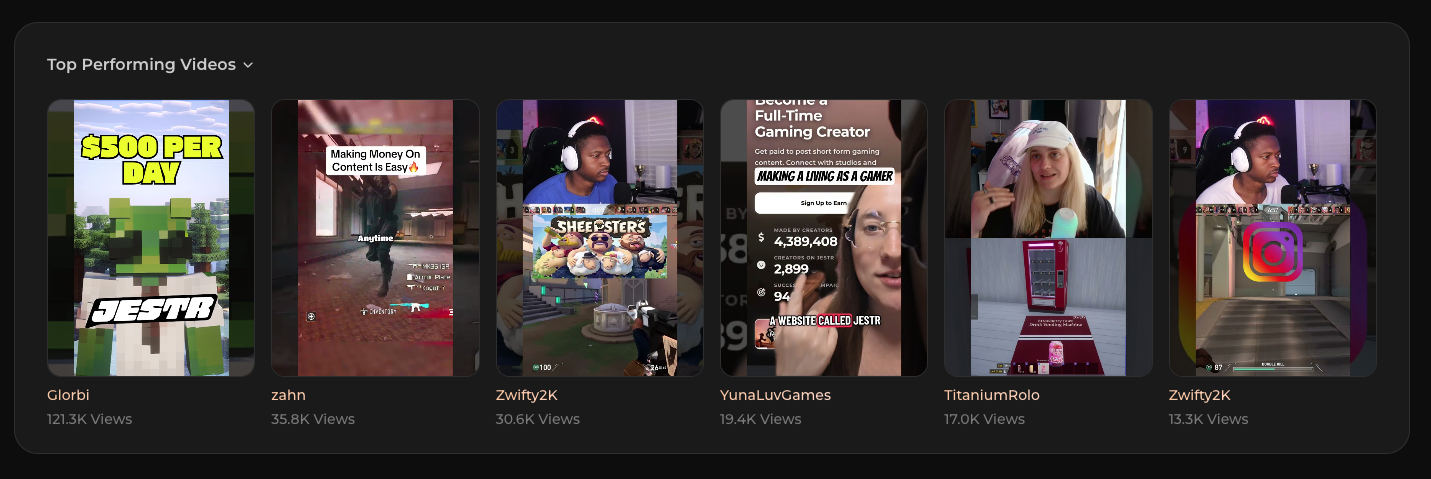
You can view all of the videos submitted to your campaign directly from the reporting dashboard.
Content can be sorted in different ways, including by newest, oldest, and most viewed, making it easy to find recent submissions or quickly identify your campaign's highest-performing content.
Individual video performance
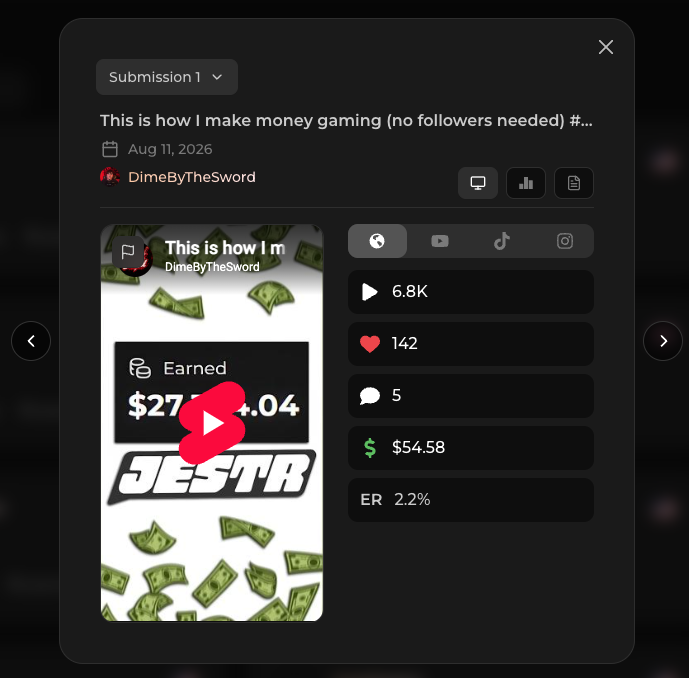
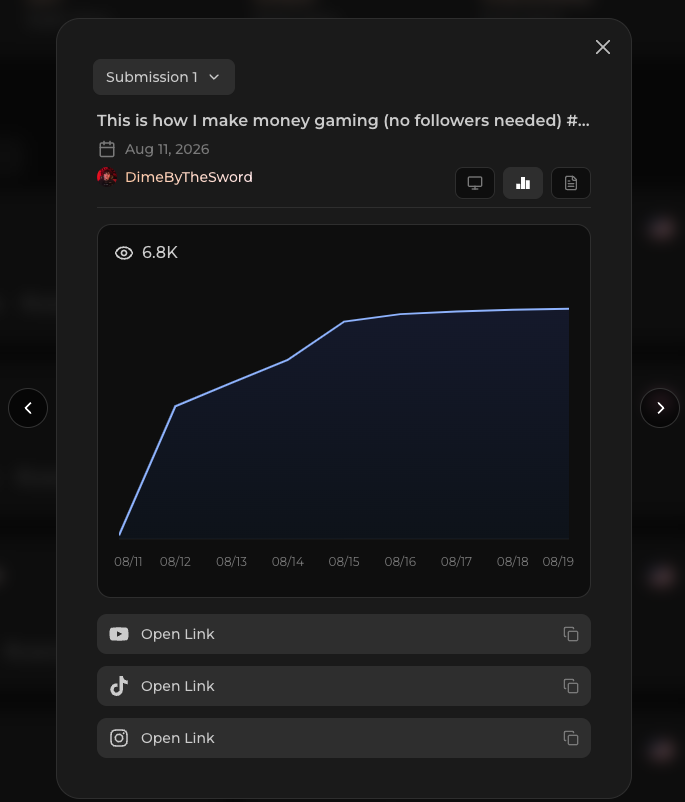
Campaign reporting goes beyond aggregate campaign and creator data. You can open an individual video to see how that specific piece of content has performed over time.
Each video includes a views over time chart alongside engagement metrics such as:
- Total views
- Engagement rate
- Likes
- Comments
If the same submission was published across multiple platforms, you can also see these metrics broken down by platform.
This lets you understand not only which content performed well, but where that performance came from and how audiences engaged with it.
Video transcripts & translations
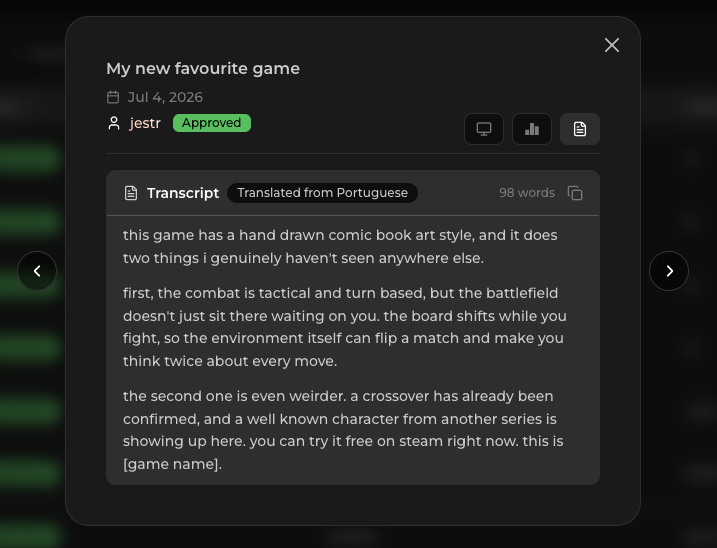
Jestr automatically provides a transcript of creator videos, making it easier to understand what creators are saying without having to watch every submission from beginning to end.
For content created in another language, the transcript is translated into English, helping your team review and understand content from creators around the world.
Taking your campaign data further
Campaign reporting isn't limited to your studio dashboard. You can share live campaign performance with clients or other stakeholders, and once your campaign is complete, export your data for further reporting and analysis.
Jestr supports shareable campaign views, CSV exports, and downloadable campaign reports.
Next step: Sharing & Exporting Reports
Whether you need to keep a client updated while a campaign is running or package up the results once it's complete, Jestr gives you several ways to share and export your campaign data.
Continue to Sharing & Exporting Reports to learn about live sharing, CSV exports, and downloadable campaign reports.